Trace ETW
High-performance tracing for C++ Desktop and Windows/Windows Phone Store apps
Project maintained by mmaitre314 Hosted on GitHub Pages — Theme by mattgraham

Event Tracing for Windows (ETW) is powerful but notoriously complex. In C#, EventSource made that technology much more approachable. This project aims at providing a similar solution for C++, both for Desktop apps and for Windows/Windows Phone Universal Store apps.
Defining events
To begin with, add an XML file with an .epx extension (as in 'Event Provider XML') to the Visual Studio project:
<?xml version="1.0" encoding="utf-8"?>
<EventProvider
    xmlns:xsi="http://www.w3.org/2001/XMLSchema-instance"
    xsi:noNamespaceSchemaLocation="http://mmaitre314.github.io/EventProvider.xsd"
    Name="MMaitre-TraceEtw"
    Guid="{A006BF16-179A-4BDF-A0A2-917AC6CA98D6}"
    >

</EventProvider>
where the Name and Guid attributes should be replaced with appropriate values. The GUID can be created using the 'Create GUID' tool in Visual Studio. The xsi attributes enable Intellisense.
A basic marker event with no payload can be added using:
<Event Name="Marker" />When the project is compiled a header gets generated from the XML file, which lets the app raise the marker event when appropriate:
#include "Events\EtwLogger.h"

EtwLogger.Marker();
where EtwLogger is the name of the .epx file.
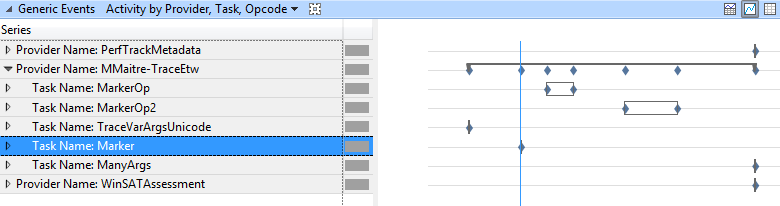
Windows Performance Analyzer (WPA) will start displaying the event:
The XML file allows defining more complex events. Events can have arguments and a trace level:
<Event Name="Trace" Level="Verbose">
    <Arg Type="Pointer" Name="Object" />
    <Arg Type="UInt32" Name="Count" />
</Event>EtwLogger.Trace(this, 314);The default trace level is Informational.
Events can also have a variable number of arguments, which generates unstructured traces (i.e. printf):
<Event Name="Trace">
    <VarArgs Type="AnsiString" Name="Message" />
</Event>EtwLogger.Trace("Received %i calls from %s", 3, "localhost");Defining task events allows tracking the beginning and end of long operations:
<Task Name="ALongOperation">
    <Start>
        <Arg Type="Pointer" Name="Object" />
    </Start>
    <Stop>
        <Arg Type="Pointer" Name="Object" />
        <Arg Type="Int32" Name="HResult" />
    </Stop>
</Task>EtwLogger.ALongOperationStart(this);
...
EtwLogger.ALongOperationStop(this, S_OK);The IsEnabled() method on the logger class allows traces which may require expensive computations to only run when events are being recorded:
if (EtwLogger.IsEnabled())
{
    string message = GatherTraceInformation()
    EtwLogger.Trace(L"Trace information: %s", message.c_str());
}
Recording and displaying events
Besides the logger header, the build also generates a set of scripts, a WPRP profile, and an event-provider manifest:
- RegisterEtwLogger.cmd/UnregisterEtwLogger.cmd - scripts to register and unregister the event provider. Must be run elevated.
- TraceEtwLogger.cmd - script to record events.
- EtwLogger.wprp - recording profile for Windows Performance Recorder (WPR)
- EtwLogger.man - event-provider manifest
The files are placed in the output folder along with the binaries.
The trace script relies on xperf to record events. It is part of the Windows Performance Toolkit like WPA and WPR. Its ability to run a merge pass on the .etl event log files tends to make it more robust when it comes to collecting event-manifest info.
In-app event recording
The project also contains an API for apps to record events fired inside their own process. This is currently not included in the NuGet package as it works in Windows apps but not in Windows Store apps (EnableTrace() function banned there).
Recording events is just a matter of creating an InProcEventListener object, passing a file path and the list of event provider GUIDs to enable:
auto listener = ref new InProcEventListener(
    ApplicationData::Current->LocalFolder,
    L"log.etl",
    ref new Vector<Guid> { MMaitre_TraceEtw }
);

EtwLogger.Trace("1");